Beautiful enough to send to your board.
Rigorous enough to act on.
Below are selected examples from a typical report: interactive charts, pricing benchmarks and a read on pricing health.
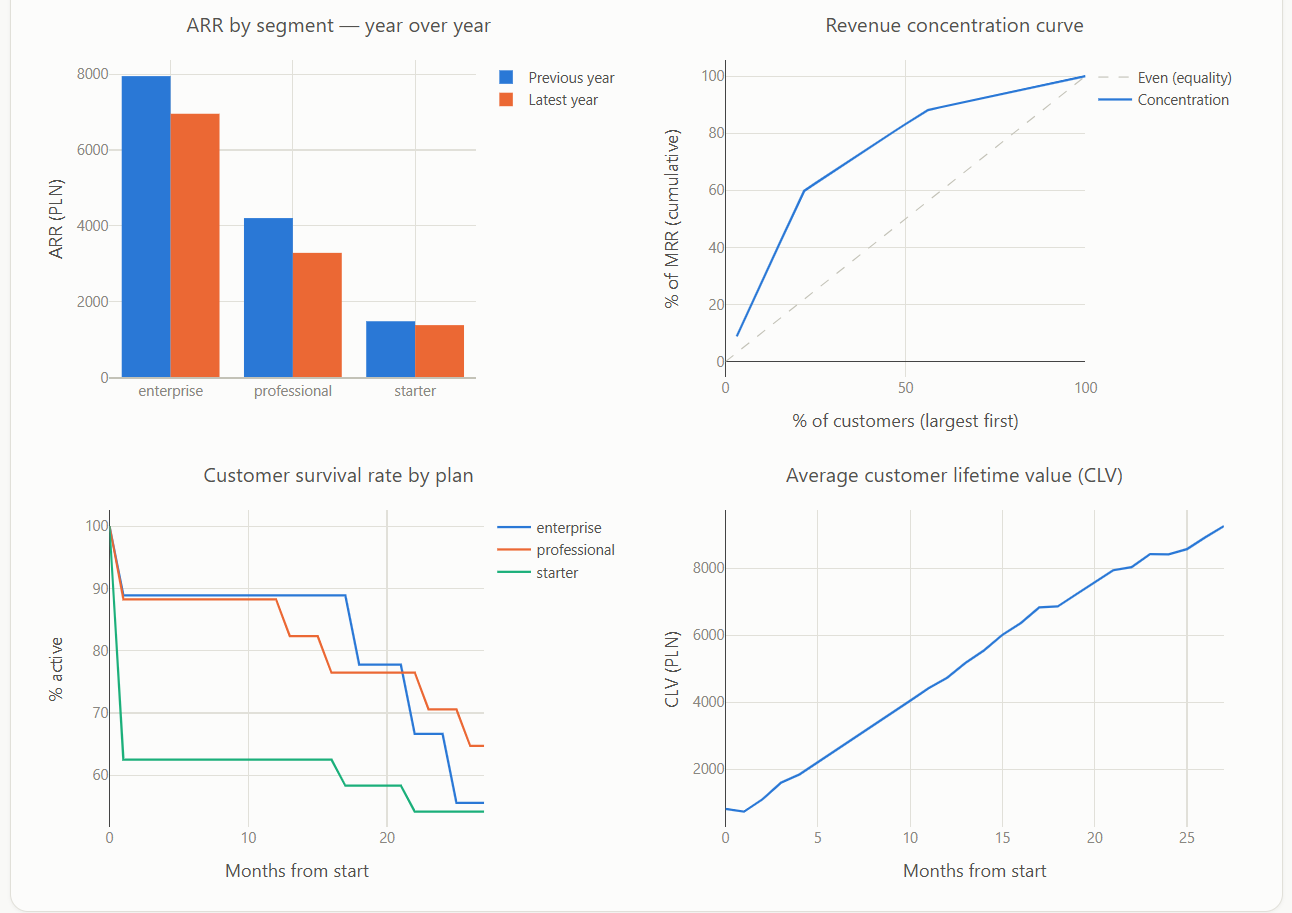
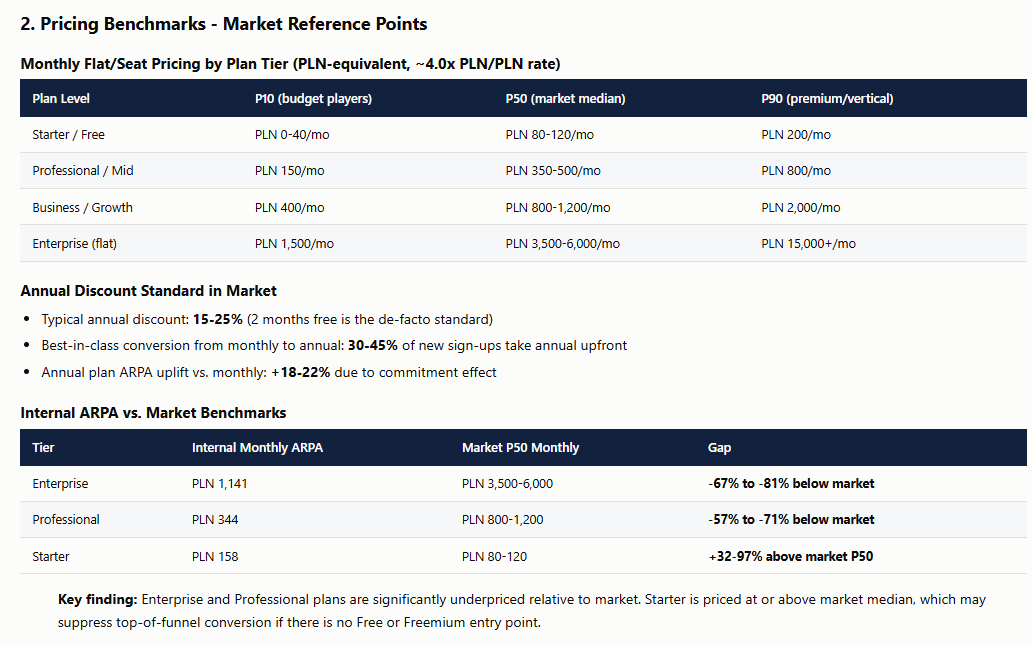
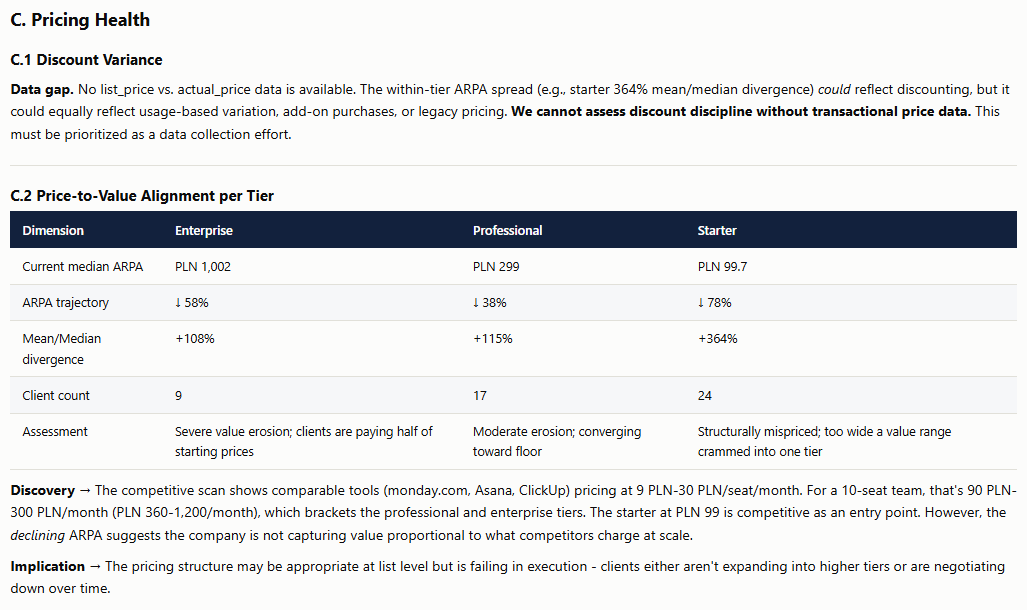
Real output, shown on sample data.
Advanced pricing analytics and revenue research
Send us your transactional and usage data. Our expert-led, AI-assisted analysis turns it into an interactive report and a ready-to-use Excel workbook, highlighting pricing gaps, retention risks and the most actionable growth opportunities. No lengthy consulting engagement - just clear evidence of where revenue may be leaking, and where it can grow.
We sign an NDA before you share any data.
The answers are already in your MRR, churn and usage data - but they're buried across exports, spreadsheets and disconnected systems. A focused, rigorous analysis shows where you may be undercharging, where revenue could be leaking, and which issues to address first.
Expert-led analysis, powered by our AI Pricing Tool
We analyze your subscription data across four connected areas - pricing structure, retention, product usage and customer segmentation. By cross-checking findings across these areas, we separate meaningful commercial signals from statistical noise.
Tier gaps, ARPA by plan, pricing logic and missing offers that may be limiting upgrade revenue.
NDR, GDR, cohort survival by plan, churn rates and whether the strongest growth opportunity lies in expansion revenue or new customer acquisition.
Feature adoption and usage patterns, underutilization signals, transaction ceilings and plan limits that may be restricting customer growth.
Data-driven customer segments, revenue concentration, value leakage and accounts with strong upsell potential - with recommended actions for each group.
A single, self-contained file that opens in any browser and is easy to share internally. Headline KPIs are presented first, followed by interactive charts and written insights structured like a consultant's memo - not a raw dashboard.
Every underlying table from the report, clearly structured and labeled: monthly MRR, MRR by plan, cohort churn, survival, CLV, customer segments, revenue concentration and more. Ready to filter and pivot, and easy to incorporate into your internal models.
Optional add-on: an editable slide deck with the key charts.
Below are selected examples from a typical report: interactive charts, pricing benchmarks and a read on pricing health.
Real output, shown on sample data.
Beyond the charts, every number behind the report ships as a structured Excel workbook (REPORT_SUMMARY.xlsx), with the key findings already summarized, so your team can start working with the results immediately.
Share it with finance for the underlying numbers, product for customer and usage segments, and leadership for the executive summary.
Illustrative findings on sample data.
Confidentiality comes first. We sign an NDA before you share any data.
Send a standard transactional export and, where available, product usage data. No system integration is required.
Receive an interactive report and Excel workbook within days, followed by a focused walkthrough call.
To get started, all we need is a signed NDA and your data export.
We start with an NDA, every time. The analysis uses only the fields required for the agreed scope of work, and - wherever possible - company identifiers are pseudonymized and personal data is removed before any dataset is used for AI-assisted analysis.
This diagnostic uses the same methodology we apply in full pricing engagements for B2B tech leaders - a direct way to see, in your own numbers, whether there's meaningful pricing upside, and a natural first step toward capturing it.
Send us the details we need to prepare your NDA. We'll email the document to the address below.